
What is Unified Data Analytics and why should you care?
Before we get into the nitty gritty detail of Unified Data Analytics, let’s remind ourselves of the cautionary tale of a pioneer of the Internet…
Have you ever heard of Netscape?
This company, which created one of the first web browsers, is most famous for its downfall: Once owning 90% of the market, within a few years it lost almost all of it.
The CEO of Netscape, Jim Barksdale, once said:
“If we have data, let’s look at data. If all we have are opinions, let’s go with mine.”
There is a grain of truth in every joke, but this joke is different. It’s the reality of how many companies operate today.
Why?
Because gathering, analyzing and interpreting data is difficult even with the latest technology we have today.
More and more companies realize just how siloed and fragmented their data is, and that data analytics is most reliable if performed in a unified manner.
In this article, we’ll review the new movement, that of unified data analytics.
What is unified data?
Unified data is the result of aggregating data from disparate sources into a single view in order to provide more complete and accurate answers to the critical questions in an organization.
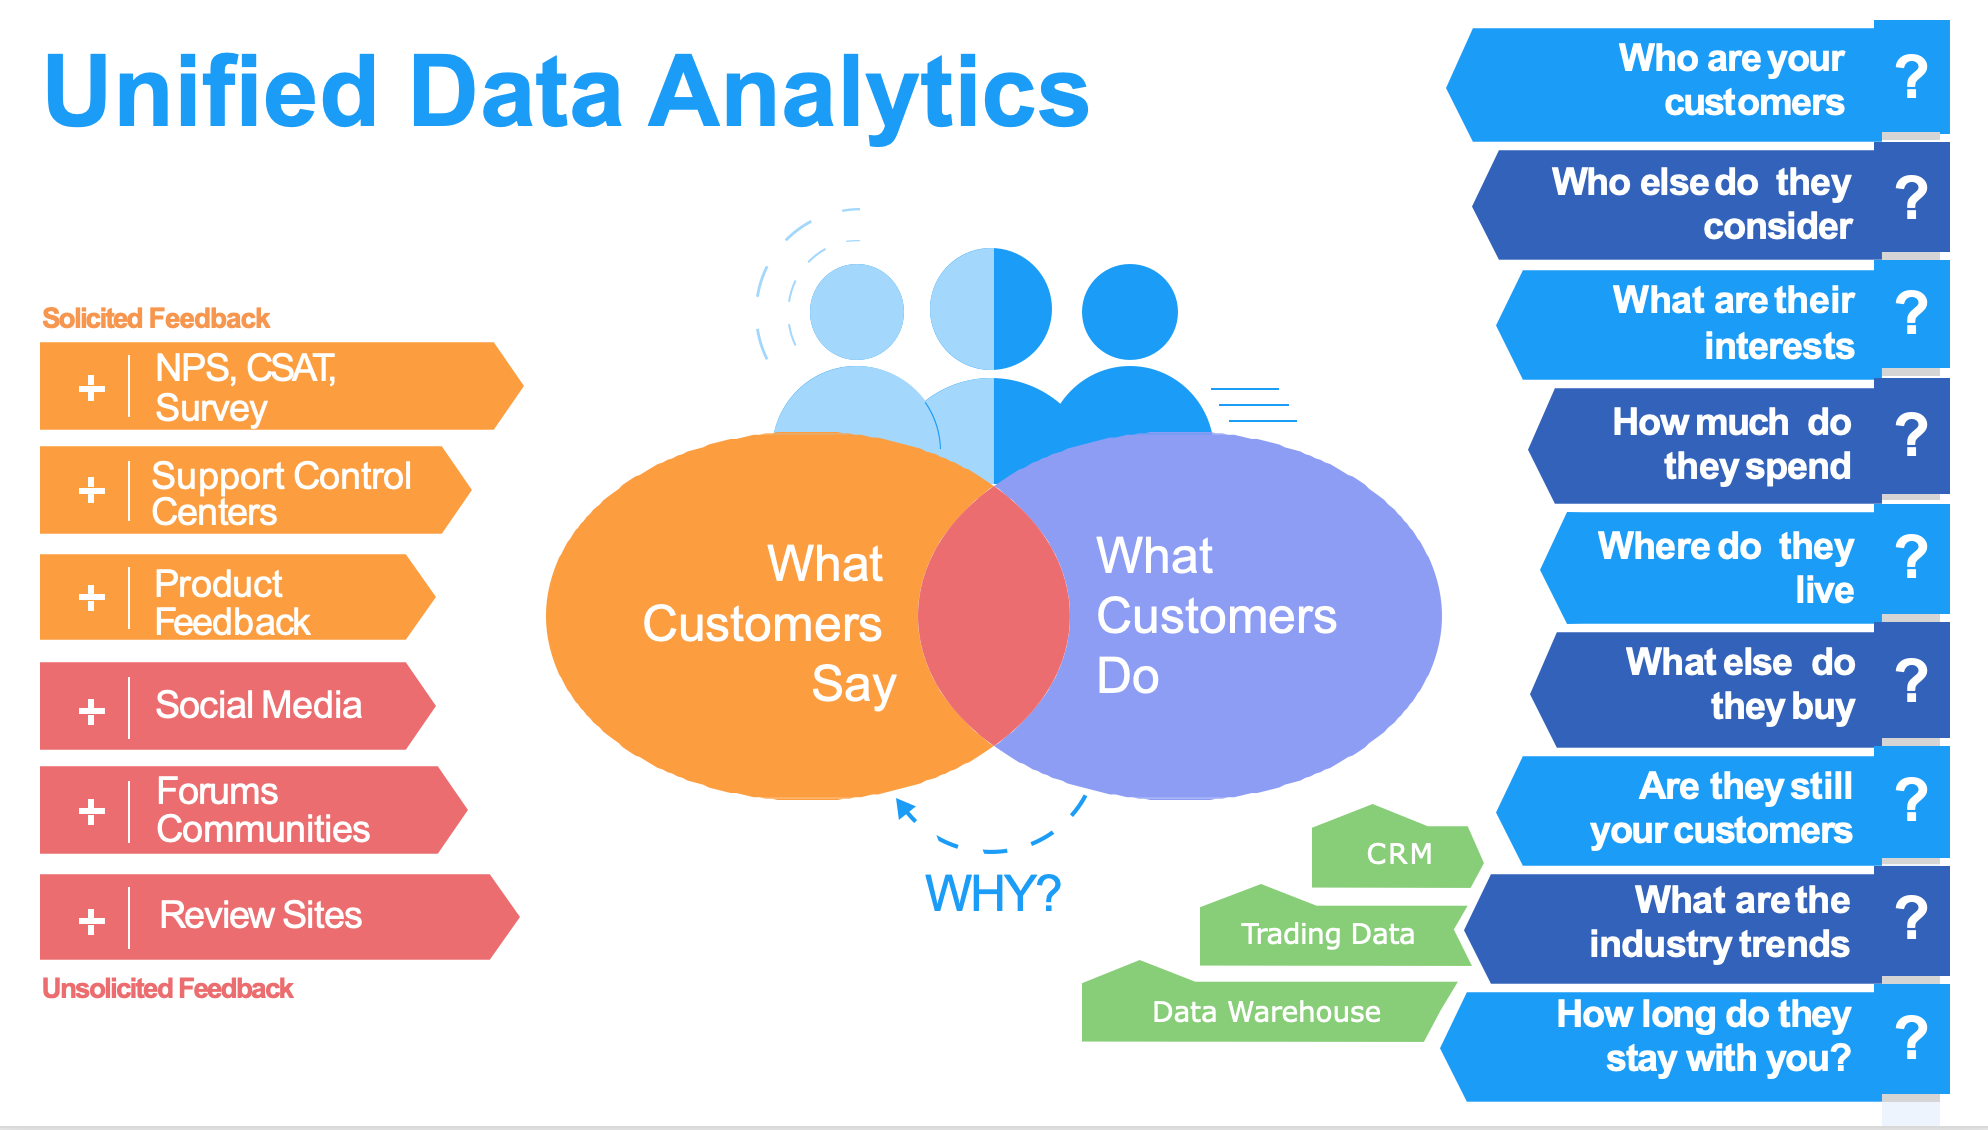
For example, one type of data that companies receive today is customer feedback.
Think about the different ways people or customers are likely to share their feedback:
- Through answering an NPS survey
- When they contact support
- By lodging a complaint
- When they try to do something online, but can not so they turn to live chat
- By sending an angry Tweet
Unifying this data in one place could provide the most accurate view of what works and what doesn’t work in the company’s current products and processes.
An even more accurate picture emerges when we unify this unstructured qualitative feedback data with structured quantitative data that captures customer behaviour:
- Product analytics data
- Purchase data
- Sequences of events on customer journey
All of this data can be unified via customer IDs in a single data warehouse.
What is unified data analytics?
Having customer data in one place is nice, but how do you actually use it effectively to get answers to your questions?
This is where analytics comes in!
Unified data analytics is the process of using technology to make sense of the data that organizations collect across channels.
In most cases, advanced technology is required: data cleaning will ensure the data is usable, entity resolution will ensure the data is accurate, and thematic analysis will help convert unstructured data into structured.
You will also need a visualization tool to understand the answers more easily. (See examples of Thematic visualizations)
How companies benefit from unified data analytics today
Companies we work with at Thematic are already benefiting from unified data analytics today, and so can you! The example below shows a real use case that your company could adopt today:
Imagine you need to answer the question, “What can we do to improve customer experience for those customers who spend the most money with us and are the most satisfied with our products?”
Here is how you would approach this using unified data analytics:
Step 1. Prepare the data to unify it in one place
Make sure that the results from your NPS or Customer Satisfaction survey have customer IDs associated with it.
For each customer ID, provide a sales metric such as Customer Lifetime Value (CLTV) alongside the ID.
Use Thematic Analysis, or a similar technology, to discover and quantify themes in customer responses to open-ended survey questions.
Step 2. Run your query across unified data
To answer your question, assuming you have all data in one place, you have a few choices:
- You could limit the query to customers with the greatest CLTV and the highest satisfaction scores, and then look at the most common themes among their responses.
- You could calculate the total CLTV for each theme among the improvement suggestions by the most satisfied customers.
- If your satisfaction scores and customer spend have a high correlation, it might be best to look at the less satisfied customers in order to understand how to increase their overall satisfaction and spend.

Step 3. Visualize the results
Oftentimes customers wants and needs are visualized via word clouds, but you will get the most accurate picture by using bar charts that group similar themes, while visualizing theme volume and impact. (Why word clouds harm insights)
Bar charts also let you visualize the difference in themes between customer segments, such as those with high versus low satisfaction.
At Thematic, we will also provide you with an overview of what will result in the greatest impact on customer satisfaction or NPS.
Why you need unified data analytics today
In many companies today, data is created and stored in information silos. Each team has become responsible for their own fraction of data, which makes it difficult for them to make data-driven decisions.
To just give one example, let’s look at performance marketing teams, which tend to focus on data related to ad performance, social analytics and content demand.
Linking this data to other data within the company will help them become more effective and successful:
- Sales data helps marketing understand which acquired leads convert to customers the fastest.
- Customer success and customer experience data provides insights into which customers are the happiest.
- Customer feedback helps to understand which aspects of product or service resonate the most with customers, and what will make customers recommend the company to others. This ultimately results in more effective customer acquisition spend.
- Product analytics data will help marketing teams learn which product features customers can’t live without and therefore should be featured in their campaigns.
Some CRMs and platforms try to cater to different types of users and use cases at once, but in many cases each team uses their own best-of-breed solution.
Aware of this fundamental flaw, companies are opening the channels and unifying data across business units.
When companies adopt unified data analytics all business units become more productive.
They are able to make better decisions and be more strategic.
Perhaps if unified data would have been easily available to the Netscape CEO, he would have made very different decisions and you would be reading this post in a Netscape browser.
Discover how Thematic can unify your feedback across channels.


